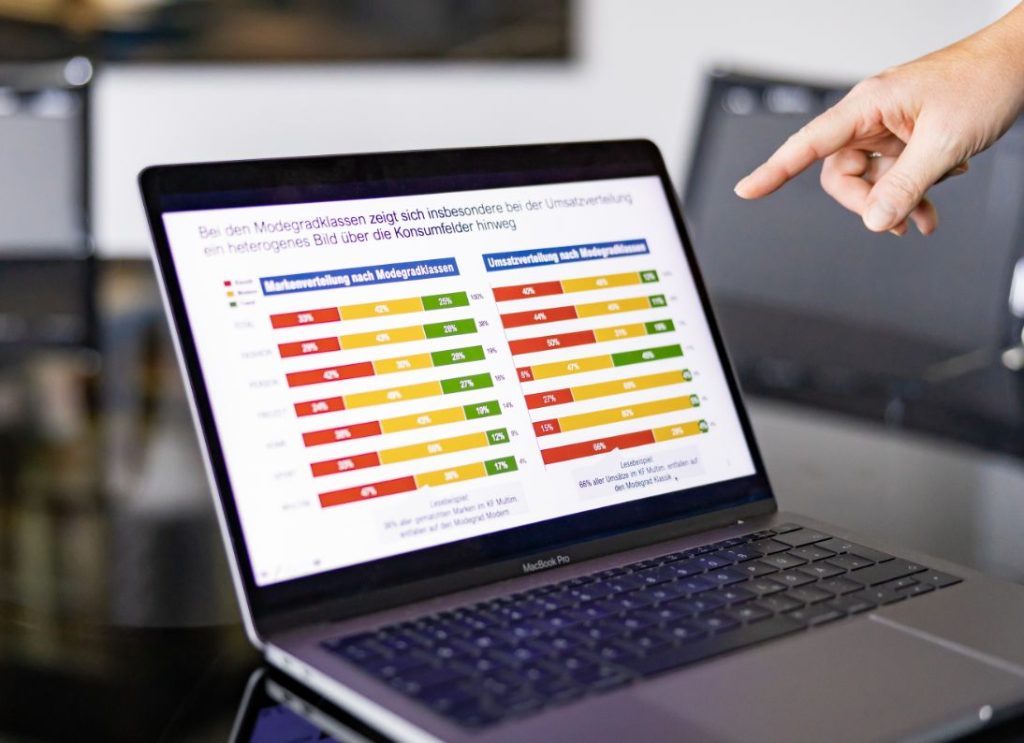

Dynamic and automated reporting in Power BI
Objective
The reporting product was designed to set up automated reporting in order to both replace existing manual reports in Excel or PPT and at the same time include strategically significant developments. We focused on orienting the varied report content, its structure and the possibilities of interacting with it, to the various application areas of diverse stakeholders.


Solution
- Standard reports for recording key information: We were able to develop a number of reports aimed at various stakeholders: management dashboard, branch reporting, omnichannel report, business case reporting, campaign reporting, daily tracking, etc.
- Individual analysis area: The analysis area is accessible to predefined users who are familiar with key figures definitions and calculation logics. Any key figures can be combined quickly and a suitable data visualisation selected.
- Training and advice: We familiarised all users (including 279 branch and affiliated managers) by holding intro sessions to enable them to quickly learn to use the tool. Regular data audits and data insight sessions are also held to enable users to interpret key figures correctly and from them, to quickly deduce recommendations for action.
Result
- Development of a portfolio with 12 reports and an authorisation concept
- Direct insights for over 400 users/stakeholders
- 250 report views daily
- Optimised decision making
- Early identification of trends
- Deduction of strategic measures

0
reports developed in the portfolio
0
users/ stakeholders provided with direct insights
0
report views daily


